Platform Observability
This guide will help you install, configure and use an observability stack in your JayeX cluster.
We selected the Grafana stack because:
- it’s open-source
- it has support for logs, metrics, and distributed traces
- it has a low memory footprint, and a great Kubernetes integration
Installation
Please follow the usual getting started guide for boot and helm 3 first.
The first step is to edit your main helmfile.yaml file located in the root directory of your development environment git repository, so that it references the helmfiles/jx-observability/helmfile.yaml file, such as:
helmfiles:
- path: helmfiles/jx/helmfile.yaml
- path: helmfiles/jx-observability/helmfile.yaml
- path: helmfiles/tekton-pipelines/helmfile.yaml
...
The second step is to create the helmfiles/jx-observability/helmfile.yaml file, with the following content:
namespace: jx-observability
repositories:
- name: jxgh
  url: https://jenkins-x-charts.github.io/repo
- name: grafana
  url: https://grafana.github.io/helm-charts
- name: prometheus-community
  url: https://prometheus-community.github.io/helm-charts
releases:
- chart: jxgh/grafana-dashboard
  name: grafana-dashboard
- chart: grafana/loki
  name: loki
- chart: grafana/promtail
  name: promtail
- chart: grafana/tempo
  name: tempo
- chart: grafana/grafana
  name: grafana
- chart: prometheus-community/prometheus
  name: prometheus
Commit and push these changes, and after a few minutes you should see grafana, loki, promtail, tempo, and prometheus pods running in the jx-observability namespace:
$ kubectl get pod -n jx-observability
NAME                                             READY   STATUS    RESTARTS   AGE
grafana-5858dbfcc4-ldhtc                         2/2     Running   0          8m25s
loki-0                                           1/1     Running   0          10m
prometheus-alertmanager-8697d479dd-9nqt7         2/2     Running   0          10m
prometheus-kube-state-metrics-685b975bb7-cds8s   1/1     Running   0          10m
prometheus-node-exporter-djdr6                   1/1     Running   0          10m
prometheus-server-65ff7b48dd-kqj2d               2/2     Running   0          10m
promtail-f26j8                                   1/1     Running   0          10m
tempo-0                                          1/1     Running   0          10m
Who’s who
- Promtail collects the logs from all running containers
- it is deployed as a daemonset on every node of the cluster so that it can read the Kubernetes log files
- Loki ingests the logs - pushed by promtail - and exposes a query API
- Tempo ingests the traces - pushed by the applications or an agent such as the OpenTelemetry Collector - and exposes a query API
- Prometheus (server) collects and ingests the metrics from the running pods
- Prometheus Alertmanager handles alerts - generated by Prometheus server, Loki or Grafana
- Prometheus Node Exporter collects hardware- and kernel-related metrics
- it is deployed as a daemonset on every node of the cluster
- Kube State Metrics collects metrics from the Kubernetes API
- Grafana is the UI that brings everything together
- Grafana Dashboard is a Helm Chart that contains Grafana Dashboards for JayeX, stored in Kubernetes ConfigMaps
Usage
Grafana is exposed through an ingress - you can retrieve its URL with the following command:
$ kubectl get ing -n jx-observability
The default credentials are stored in the grafana Kubernetes Secret:
- the default user is
admin - the default password has been auto-generated at installation time, you can retrieve it with the following command:
$ kubectl -n jx-observability get secret grafana --template='{{index .data "admin-password"}}' | base64 --decode
Once you are logged in, you can play with the pre-defined dashboards, or with the Grafana Explorer.
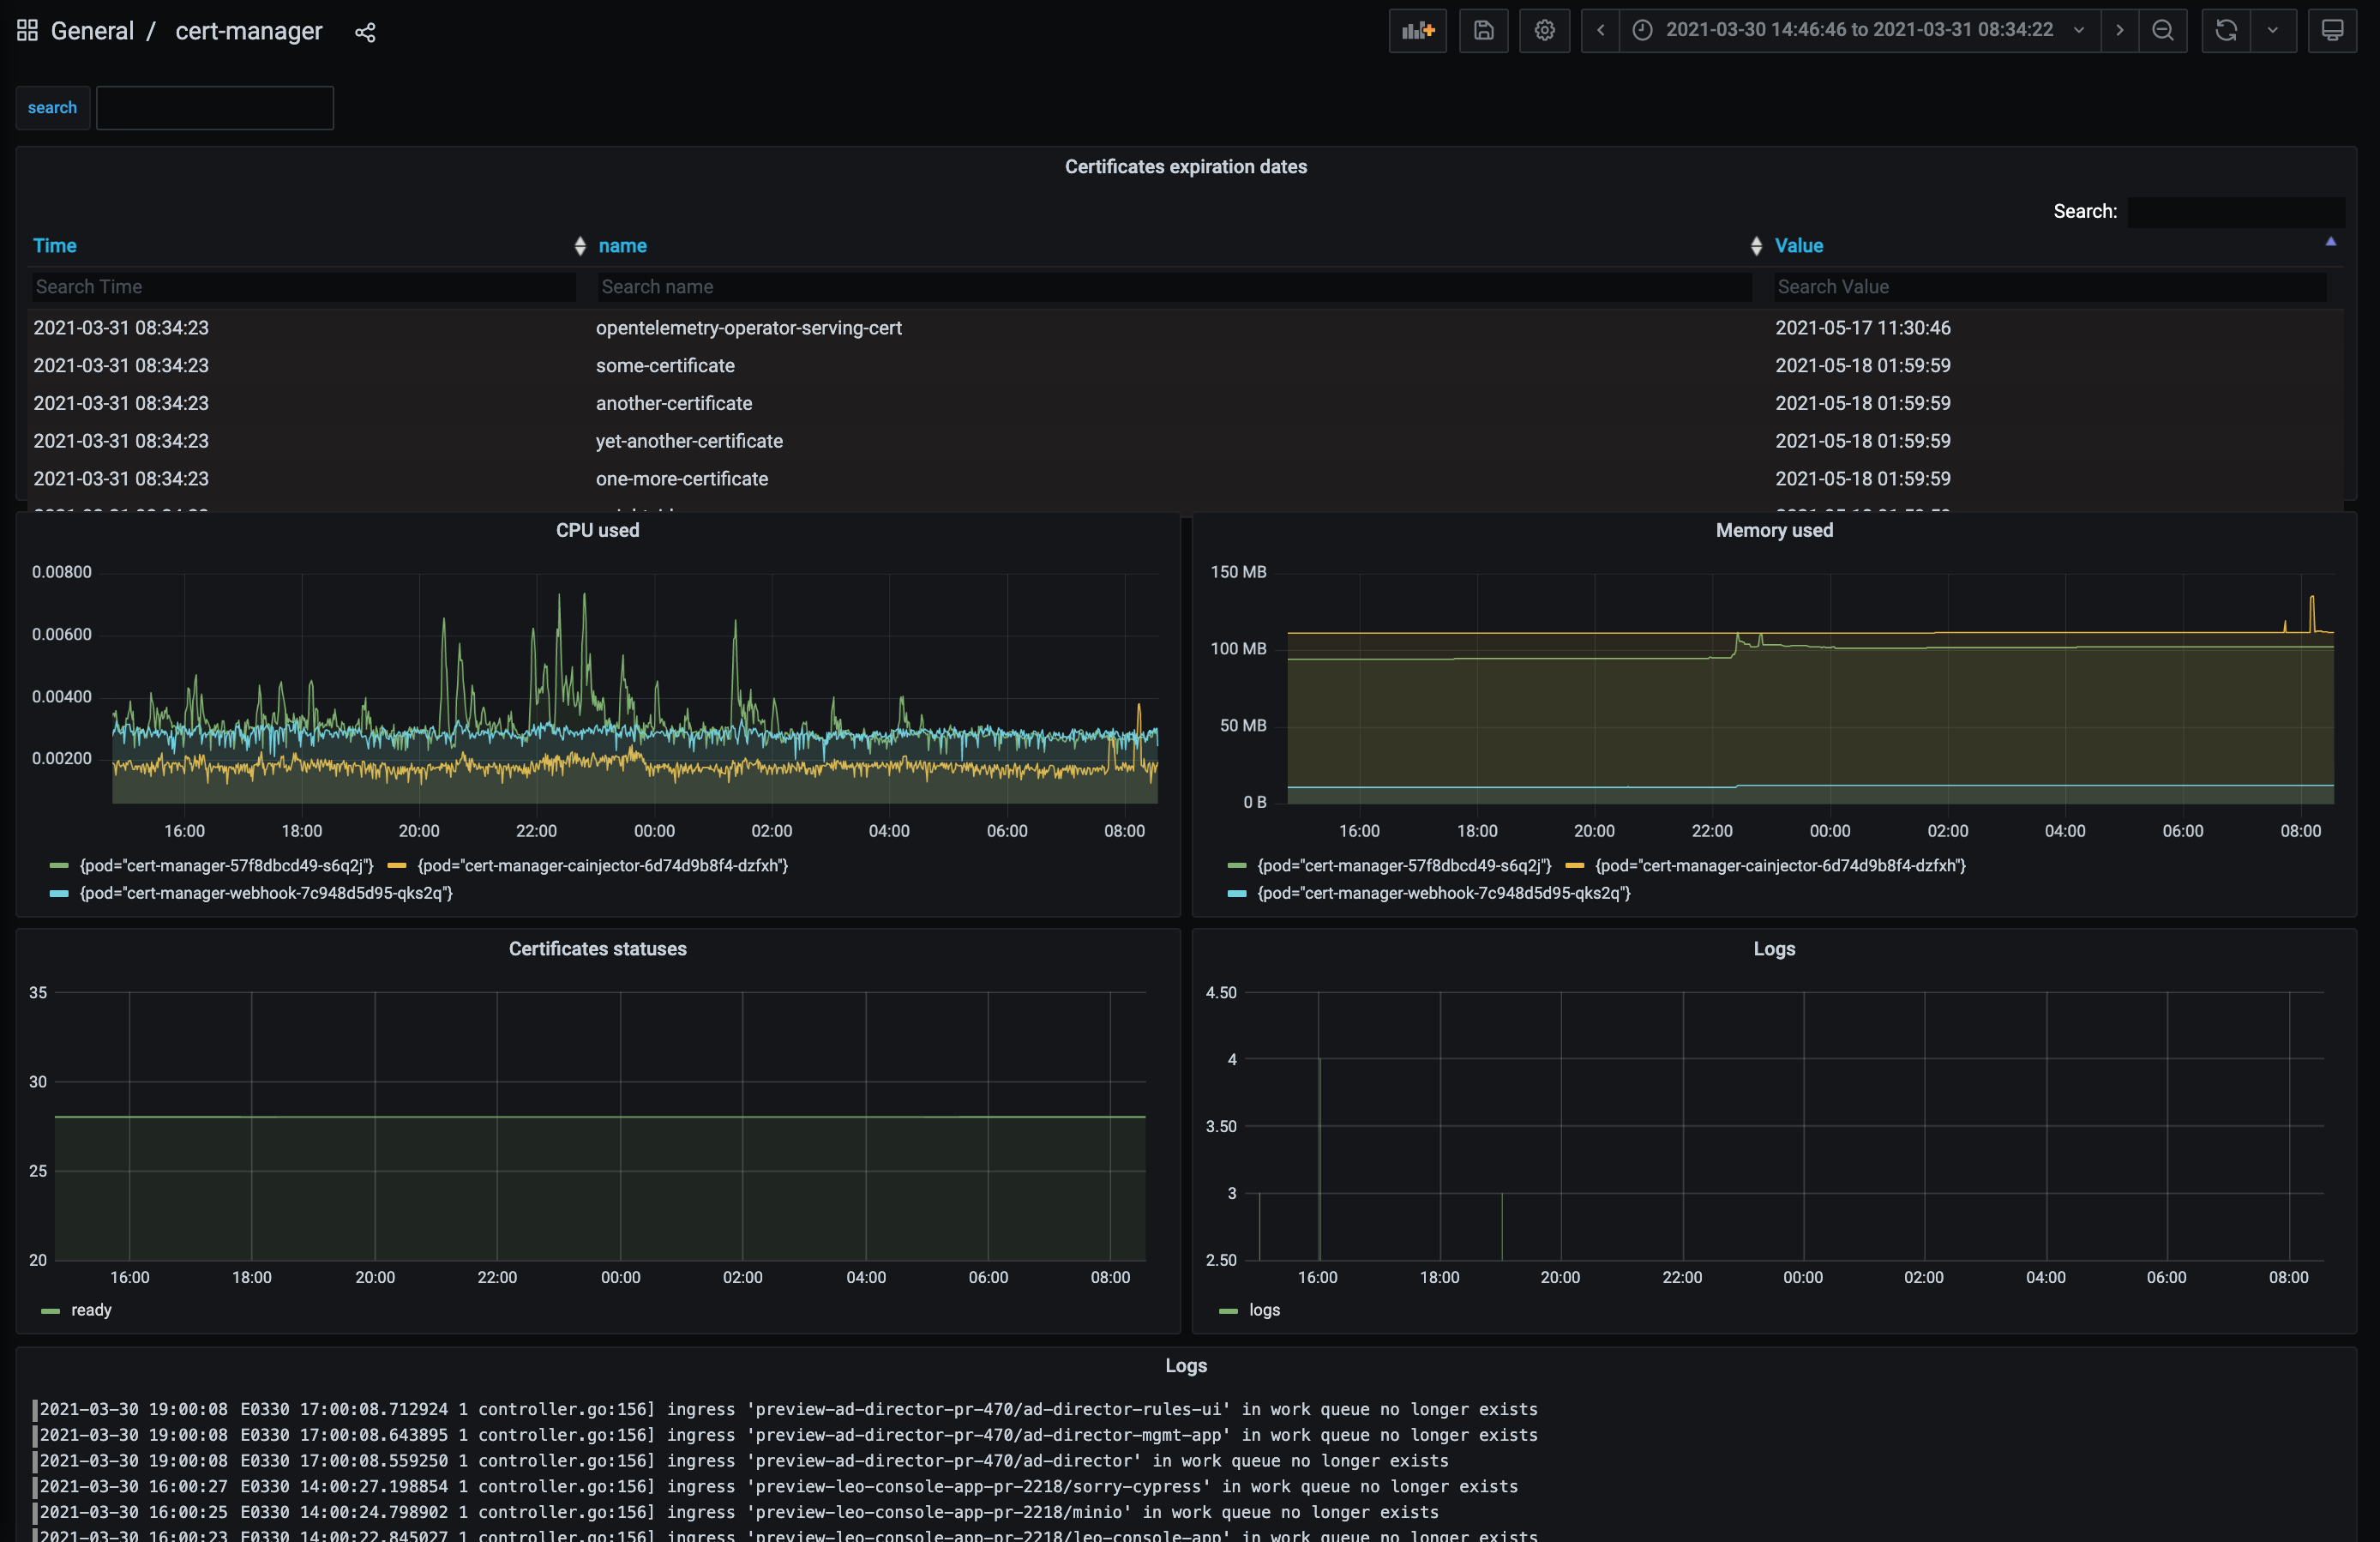
This is an example of a pre-defined dashboard, for cert-manager, where we display on the same dashboard metrics collected by Prometheus (including the certificates expiration dates) and logs collected by Loki/Promtail:
Configuration
The configuration is defined in “values files” stored in the JayeX Version Stream:
- Grafana configuration
- Loki configuration
- Promtail configuration
- Tempo configuration
- Prometheus configuration
If you want to change anything from the default configuration, you can either:
- submit a Pull Request if you believe this change is beneficial for everybody
- or create a new values file in your development environment git repository, in the
valuesdirectory- for example,
values/grafana/values.yamlfor Grafana, orvalues/prometheus/values.yamlfor Prometheus
- for example,
Next steps
Once the Grafana stack is installed and configured, you can:
- visualize pipelines traces from the JayeX Pipelines Visualizer
- install the Continuous Delivery Indicators addon
- expose Prometheus metrics from your own applications
- export traces from your own applications, using OpenTelemetry
- create Grafana dashboards for your applications
- contribute to the JayeX Grafana Dashboards
Feedback
Was this page helpful?
Glad to hear it! Please tell us how we can improve.
Sorry to hear that. Please tell us how we can improve.